
How complex material becomes usable decisions.
The underlying client material stays private. What is shown here is how each engagement was structured — what was collected, what it revealed, what I built, and how leadership used it.
Eight weeks inside a 375-person CRO
A 92-step workflow ran across seven departments with no single owner per step. Accountability existed, but only in people's heads.
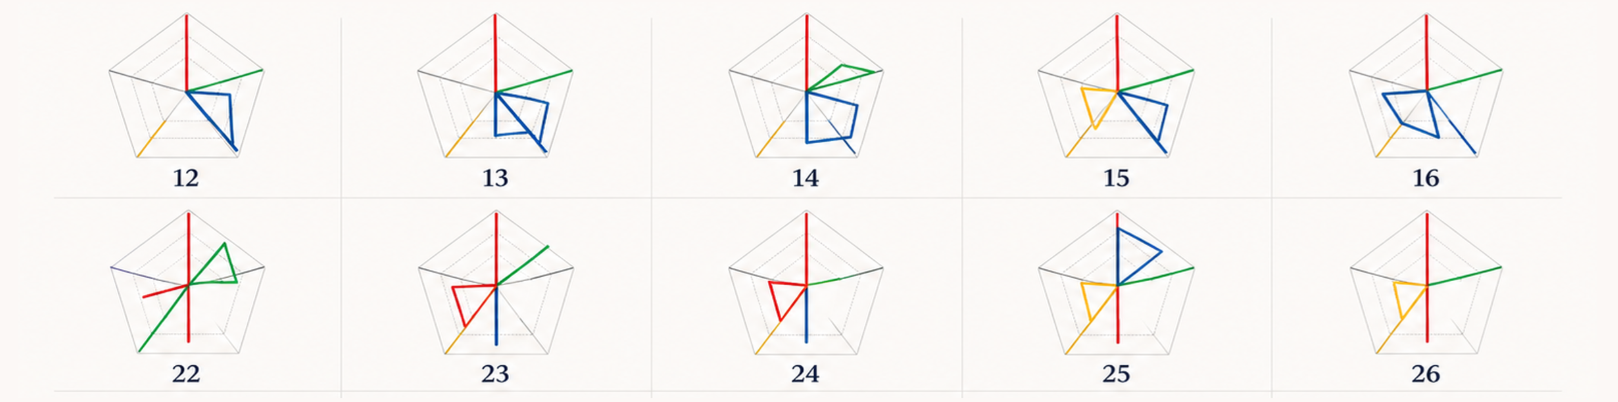 ▶ Watch the handoff move · 18s
Each chart is one client engagement. Ownership jumps between departments step to step — the lifecycle is not uniform, and no client had a stable point of contact.
30 interviews in 30 days — about 8% of staff — across seven departments, two full-participation surveys, and 2,000 contracts analyzed for pricing variation.
Entered shadowing a senior director, without formal authority. The CCO later assigned a client-sentiment project directly.
Wrote code to generate an ownership chart for every engagement across the 92-step, seven-department matrix — making visible where responsibility changed hands mid-engagement.
Adding and subtracting steps became a way to calibrate the client experience. The hosting senior director joined Altigad's advisory board.
Two more, in brief.
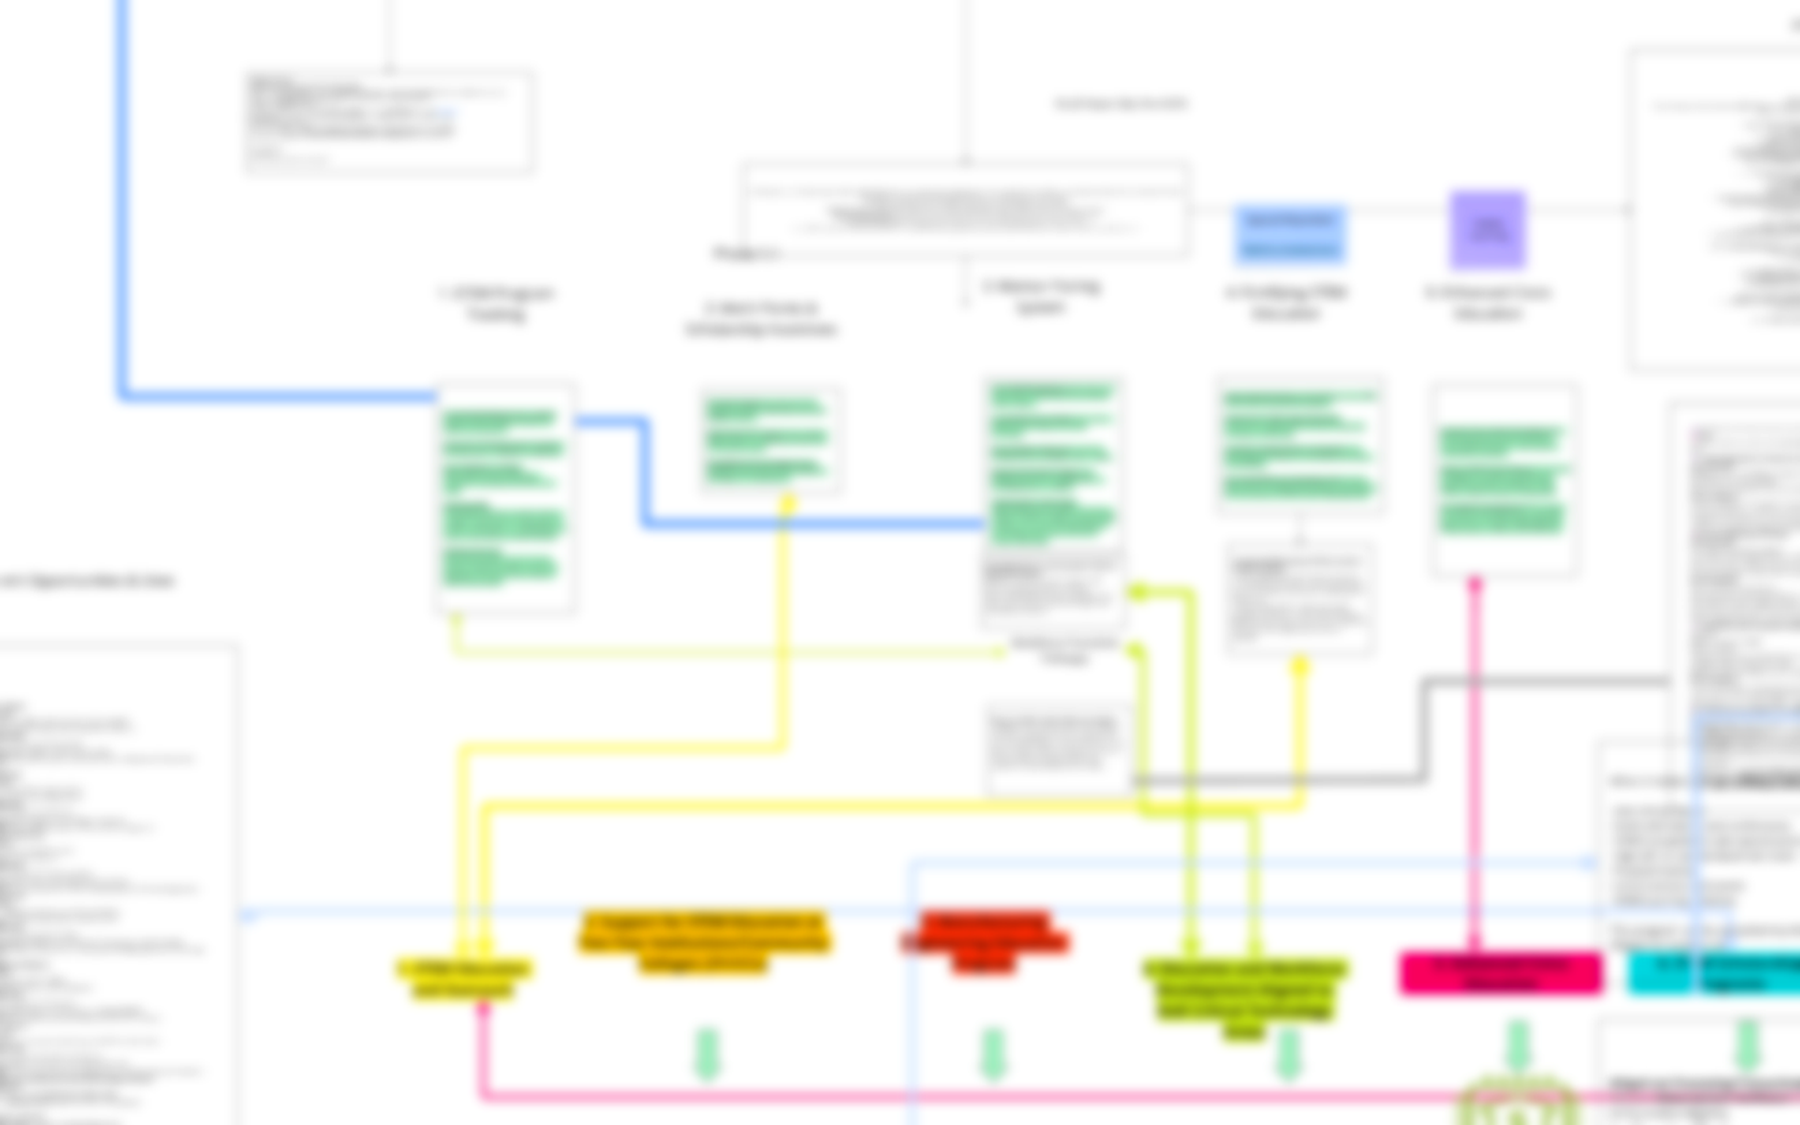
Mapping the leverage points across a federal landscape
Federal awards, program authorities, and reporting lived across systems that were never designed to be read together. The map assembled them into one operating view.
The structure revealed where funding, authority, and reporting diverged.
Useful when no single system holds the full landscape.
 ▶ Watch it build · 53s
The research system behind an awarded proposal
Four days before the deadline, the organization had no shared evidence base. Sources were gathered, parsed, organized, and connected as the proposal took shape.
The proposal was the visible output. The evidence system made it credible.
Useful when a decision must be built from fragmented material.
Built inside engagements when an existing tool could not answer the question.
- 01 Federal award scanner Python Structures prime awards, subrecipients, domicile, and dollar flow so they can be read against each other.
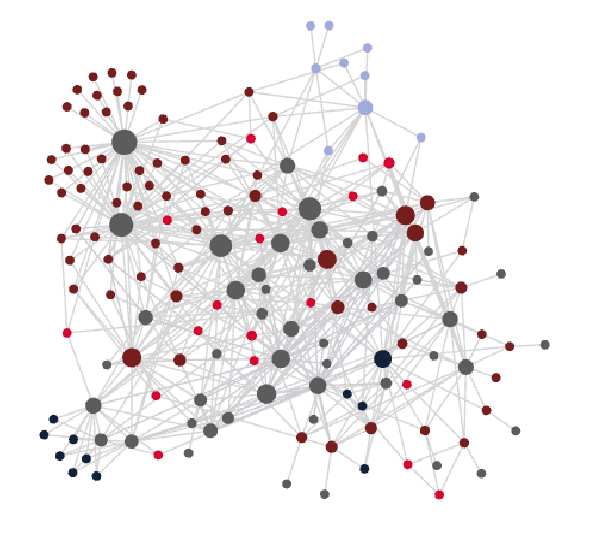
- 02 Similarity graph Data visualization Clusters people by what they have in common rather than by where they sit — informal structure no org chart holds.
Bring the material and the question you need to answer.
This work starts with the organization's own material — records, workflows, systems, and stakeholder context. If something important is hard to see clearly, that's usually where the engagement begins.